
Analytics (4)
In order to understand whether or not your system is producing according to expectations, it is critically important to configure SolarView with monthly production estimates. When your solar installation company made a proposal to you, that proposal should have included an estimate of the expected energy production they would be delivering with their system. That estimate should have taken into consideration variable factors such as climate, shading, and roof vent locations relative to the proposed solar panel models and configuration. If this estimate was done systematically and comprehensively, it should include a month-by-month breakdown of anticipated production for the proposed system, stated in kWh units of production.
If you don’t already have these estimates, you should obtain them from your solar installer. Plug that data into your SolarView settings page.
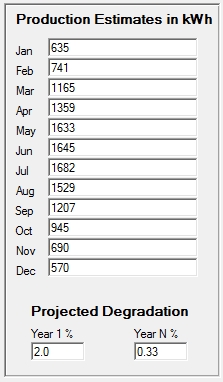
Once this data is entered, SolarView will provide a continuous view of the accuracy of those estimates over the full life of your system. You can find this information by going to the Reports menu in the SolarView Desktop app and selecting “Actual vs Projected”. If it turns out that your installer significantly over-estimated your production, this report will give you the necessary ammunition to discuss an appropriate remediation plan with your installer. After all, lost production equates to a bigger electric bill, so if their estimates were not reasonably accurate then some form of mitigation may be in order.
It’s easy to export your production data in a format that can be opened in Excel for detailed analysis.
- In the SolarView app, go to the Custom Reports.
- Generate the default report by clicking Show Report, or select custom options to generate a different report.
- Click the Email CSV button to send the CSV file to your default email as configured in Other Settings.
Open the email on your computer or other device. Click the CSV attachment to open it in your default CSV program on that device. Or, save the attachment and then open it in Excel or another application.
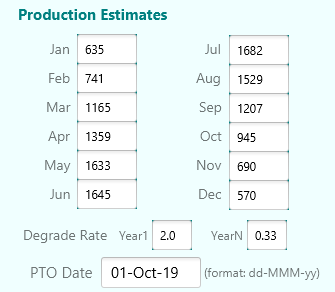
Although highly durable, solar panels will degrade in efficiency over time. This means that a 30 year old panel will not produce as much electricity as it did when it was brand new. It is important to take this factor into consideration in order for you to determine if your system is producing at the rate that it should. This is especially important if you want to hold your solar installer accountable for promises made when they sold you your system.
Solar panels typically come with 20 year warranties that guarantee that the panels will produce at least 80% of the rated power after 20 years of use. The rate at which the panels degrade depends on the brand and model of panel. Each manufacturer provides estimates for degradation rates, which are typically highest in the first year and then lower for subsequent years. For example, the LG335N1C-A5 panel is projected to degrade by 2% in the first year, and 0.5% for each subsequent year. By contrast, the LG335N1C-V5 panel is projected to lose 2% in its first year, but only 0.33% in each subsequent year. Over the course of a couple of decades, these differences can be significant.
SolarView takes this degradation into consideration as it provides you with ongoing reports of system performance. The Settings page allows you to configure the monthly production estimates, as provided to you by your solar installer, and the degradation rates for the panels, as provided by the panel manufacturer:
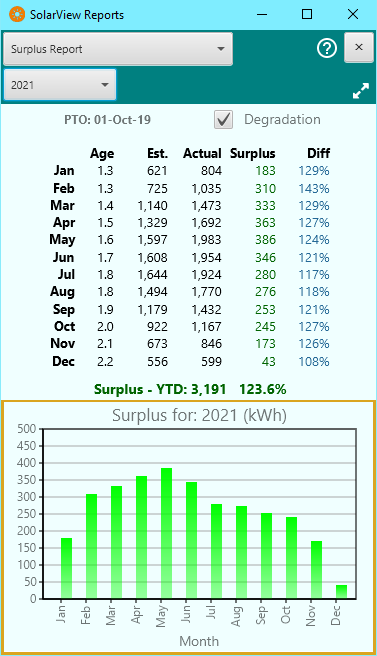
Once this information has been entered into the SolarView settings, the system will keep track of your production month over month, and year over year, so you will know if the system is producing energy at the rates guaranteed in your installation contract. If the system is falling short of your installer’s contractual guarantees you will have the data that you need to explore remedies.
SolarView gives you access to this data in two ways. Each month, SolarView will email and/or text a production report to you that will also include an estimate of production surplus or deficit based on the estimates and degradation rates that you entered in Settings. In addition, the Reports menu in the SolarView desktop monitor will allow you to browse results by year. In the example below, the report reveals that the system has been producing a surplus of energy, compared to the estimates provided by the solar installer, since going online in October, 2019.
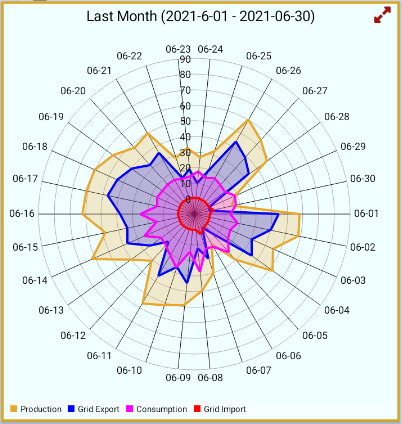
SolarView is capable of detecting your energy usage statistics (consumption, self-consumption, grid import, and grid export) and displaying it to you in tables and graphs. However, SolarView can present this data to you only if your SolarEdge inverter collects such data in the first place. If your SolarEdge inverter does not collect consumption data, you will only see data about your energy production.
About one third of users have consumption data, either because they have a solar battery/storage system, or their SolarEdge inverter is integrated with a separate consumption meter. If you are interested in such a capability, you should contact your solar installer to inquire about your options.
Features (2)
In order to understand whether or not your system is producing according to expectations, it is critically important to configure SolarView with monthly production estimates. When your solar installation company made a proposal to you, that proposal should have included an estimate of the expected energy production they would be delivering with their system. That estimate should have taken into consideration variable factors such as climate, shading, and roof vent locations relative to the proposed solar panel models and configuration. If this estimate was done systematically and comprehensively, it should include a month-by-month breakdown of anticipated production for the proposed system, stated in kWh units of production.
If you don’t already have these estimates, you should obtain them from your solar installer. Plug that data into your SolarView settings page.
Once this data is entered, SolarView will provide a continuous view of the accuracy of those estimates over the full life of your system. You can find this information by going to the Reports menu in the SolarView Desktop app and selecting “Actual vs Projected”. If it turns out that your installer significantly over-estimated your production, this report will give you the necessary ammunition to discuss an appropriate remediation plan with your installer. After all, lost production equates to a bigger electric bill, so if their estimates were not reasonably accurate then some form of mitigation may be in order.
SolarView is capable of detecting your energy usage statistics (consumption, self-consumption, grid import, and grid export) and displaying it to you in tables and graphs. However, SolarView can present this data to you only if your SolarEdge inverter collects such data in the first place. If your SolarEdge inverter does not collect consumption data, you will only see data about your energy production.
About one third of users have consumption data, either because they have a solar battery/storage system, or their SolarEdge inverter is integrated with a separate consumption meter. If you are interested in such a capability, you should contact your solar installer to inquire about your options.
Monitoring (2)
Although highly durable, solar panels will degrade in efficiency over time. This means that a 30 year old panel will not produce as much electricity as it did when it was brand new. It is important to take this factor into consideration in order for you to determine if your system is producing at the rate that it should. This is especially important if you want to hold your solar installer accountable for promises made when they sold you your system.
Solar panels typically come with 20 year warranties that guarantee that the panels will produce at least 80% of the rated power after 20 years of use. The rate at which the panels degrade depends on the brand and model of panel. Each manufacturer provides estimates for degradation rates, which are typically highest in the first year and then lower for subsequent years. For example, the LG335N1C-A5 panel is projected to degrade by 2% in the first year, and 0.5% for each subsequent year. By contrast, the LG335N1C-V5 panel is projected to lose 2% in its first year, but only 0.33% in each subsequent year. Over the course of a couple of decades, these differences can be significant.
SolarView takes this degradation into consideration as it provides you with ongoing reports of system performance. The Settings page allows you to configure the monthly production estimates, as provided to you by your solar installer, and the degradation rates for the panels, as provided by the panel manufacturer:
Once this information has been entered into the SolarView settings, the system will keep track of your production month over month, and year over year, so you will know if the system is producing energy at the rates guaranteed in your installation contract. If the system is falling short of your installer’s contractual guarantees you will have the data that you need to explore remedies.
SolarView gives you access to this data in two ways. Each month, SolarView will email and/or text a production report to you that will also include an estimate of production surplus or deficit based on the estimates and degradation rates that you entered in Settings. In addition, the Reports menu in the SolarView desktop monitor will allow you to browse results by year. In the example below, the report reveals that the system has been producing a surplus of energy, compared to the estimates provided by the solar installer, since going online in October, 2019.
SolarView is capable of detecting your energy usage statistics (consumption, self-consumption, grid import, and grid export) and displaying it to you in tables and graphs. However, SolarView can present this data to you only if your SolarEdge inverter collects such data in the first place. If your SolarEdge inverter does not collect consumption data, you will only see data about your energy production.
About one third of users have consumption data, either because they have a solar battery/storage system, or their SolarEdge inverter is integrated with a separate consumption meter. If you are interested in such a capability, you should contact your solar installer to inquire about your options.