To learn about features available in the free and licensed versions of SolarView, click on a feature below.
To learn about features available in the free and licensed versions of SolarView, click on a feature below.
Allows the user to examine their solar energy status on demand. For proactive monitoring, where our service monitors for you and notifies you of issues by text or email, choose a Proactive license.
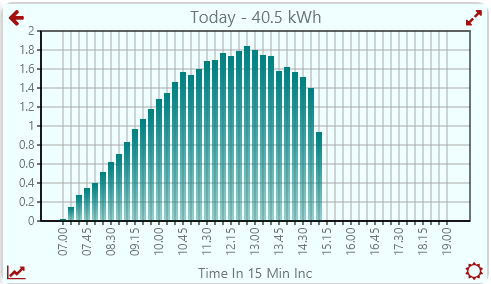
The live production graph gives you a convenient visual indication of ongoing production. It is refreshed periodically if you keep the app open, based on data available from your SolarEdge inverter.
This feature shows the location of the current site using Google Maps. All Google Maps functions are available, including zoom in / out and satellite views.
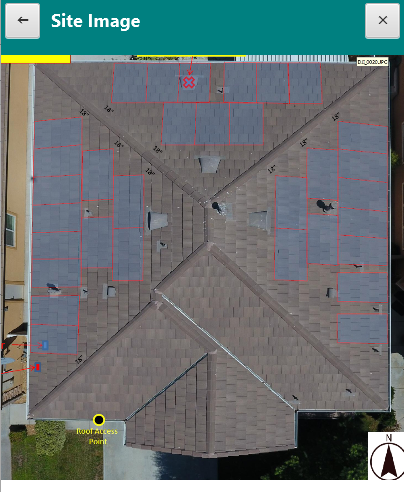
If a site photographic image has been uploaded to SolarEdge by you or your solar company, tapping the Site Image icon will display the image.
The main screen shows current site weather conditions. Tapping on it shows the weather forecast of the current site using Google Weather. Note that the current weather conditions may not match exactly to the weather conditions shown in the SolarView app due to differences in weather stations.

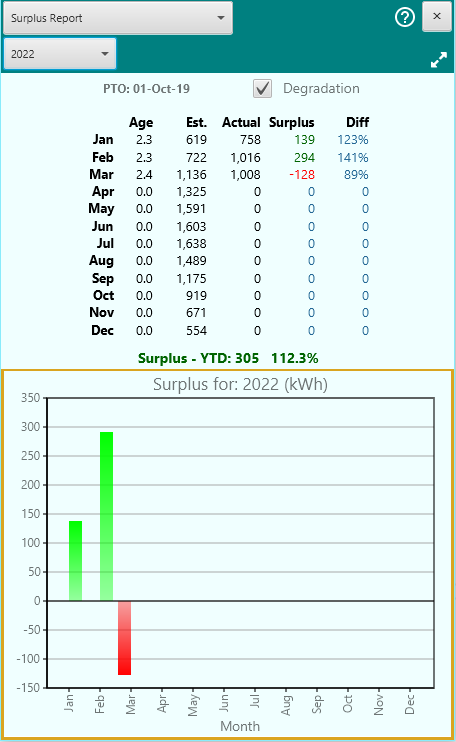
The Surplus Report provides:
Note that at the start of a new month, your full estimate for the month is counted, but your actual production will start at zero and gradually rise as the month progresses.
Future months, or any months prior to your PTO (Permission to Turn On – your solar startup date), will show 0 production
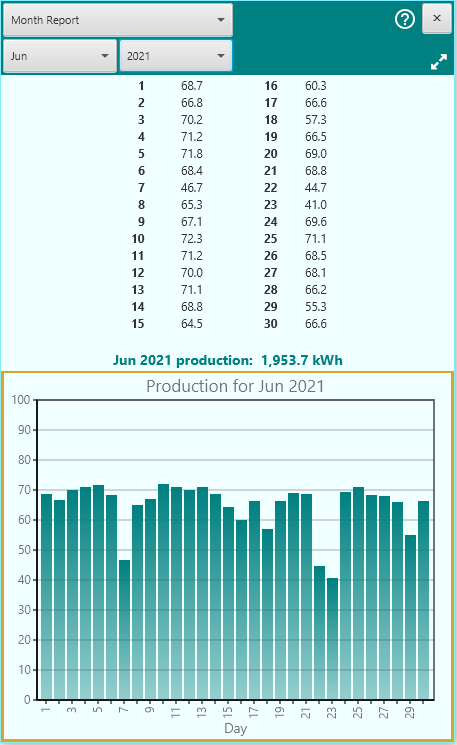
The Month Report provides the total energy production for a specified month and year, broken down by day of the month.
Future days and months, or any periods prior to your PTO (Permission to Turn On – your solar startup date), will show 0 production.
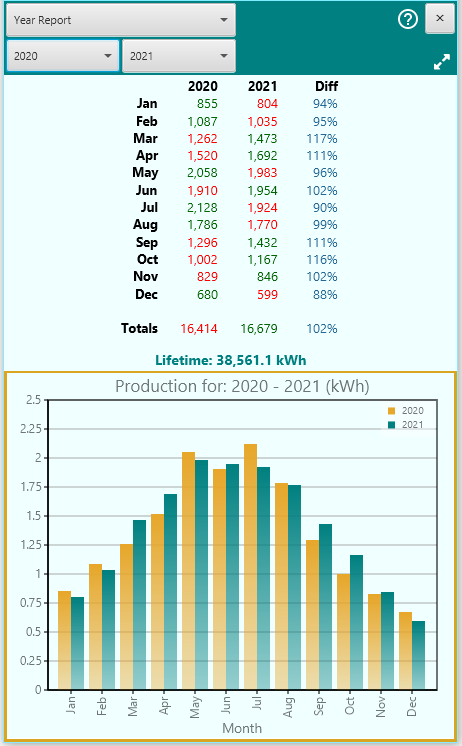
The Year Report shows either a three year overlay graph, or a year-over-year comparison of production between any two selected years since activation, broken down by month.
If the left selection is “Multi”, the three year overlay will be shown ending the year selected on the right. Otherwise a year over year comparison is shown. By default, the three year overlay is shown.
If the monthly production for given year is less than that for the other year(s), it is shown in red, otherwise it is shown in green.
Future months, or any months prior to your PTO (Permission to Turn On – your solar startup date), will show 0 production.
For year over year comparisons, the “Diff” column shows the percentage change between the two years. A value of 100% would indicate no net change between the two years. For example if the January 2020 production was 1000 and the January 2021 production was 950, the Diff would be 95%. If it were the other way around, the Diff would be 105%.
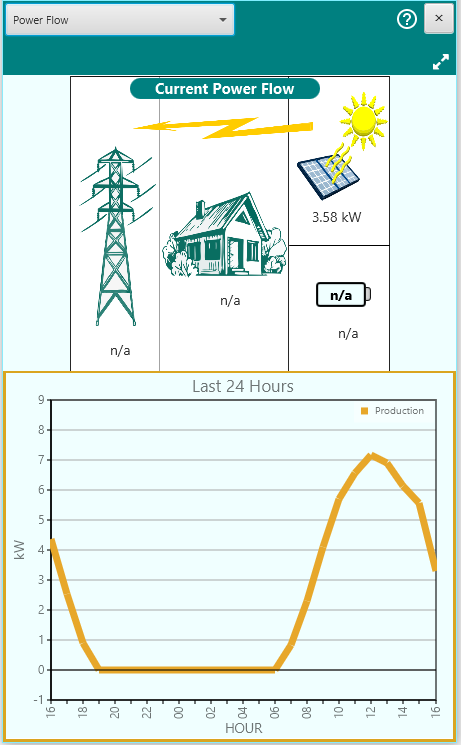
Select the Power Flow report to view a graphic depiction of the current flow of power between various components in your system. Note: If your system is not equipped with an integration to a consumption meter, this view will show only energy production results.
However if you have an integrated consumption meter, this view will show current flow between the grid, your panels, your home, and (if equipped) your storage battery.
Power can flow from your PV panels to your home load/mains or your storage battery. It can also flow between the home load/mains and storage battery, and between the power grid and the home load/mains. The amount and direction of flow depends on factors such as daylight, grid availability, battery capacity, and the configuration of your system.
The current amount of power flow is indicated next to each icon, and the direction of power flow is indicated with lightning bolt arrows between the icons.
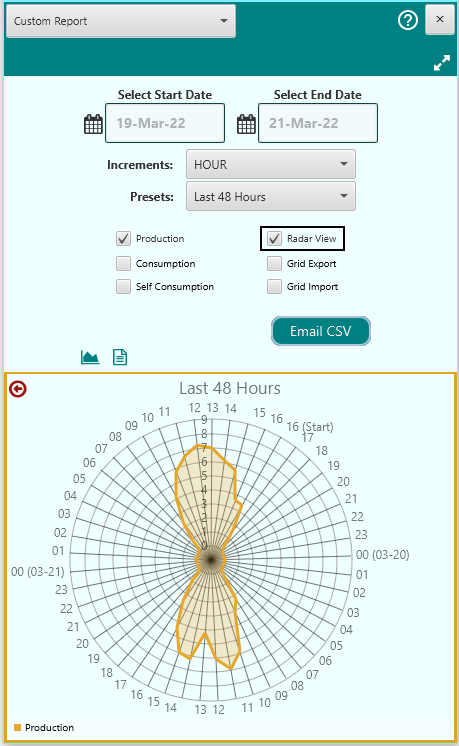
The Custom Report function allows you to generate production and power flow graphs, tables, and CSV exports for any duration of time and multiple time increments.
Note: SolarEdge limits your data requests per day. If you generate too many reports you may be locked out for a period of time. Try to limit your report requests to a handful per day.
To create a custom report, select the Start and End dates and if desired select the report granularity with the Increments drop-down.
The reports can be viewed three ways:
Graphic mode (default) – tap the graph icon ![]() .
.
Text/Table mode – tap the page icon ![]() .
.
CSV file – Once you have created a report, you can tap the Email CSV button to send a CSV data file your default email address. You can open the CSV file in Excel for further analysis and manipulation of the data. Once the checkbox is checked, a CSV report will be emailed each time a new report is generated.
If you are viewing a Preset report, you can extend the time period backward one time unit by clicking the Report Back icon ![]() .
.
By default, all sites have access to Production data. If your site is equipped with a consumption meter that is integrated into your SolarEdge inverter, you will also be able to view the following additional data: Consumption (all energy consumed by your site), Grid Export (excess energy exported to the electrical grid), Grid Import (energy imported from the grid to meet your site demand), and Self-Consumption (energy consumed from non-grid sources such as a storage battery).
By default, custom graphs are rendered as line charts. You may also check the Radar View box to render graphs as radar charts. The radar view can make it easier for you to visualize your energy flow history.

For convenience, there are several preset combinations of dates and increments. These are accessed by tapping the Presets drop down.
With a Proactive license, SolarView monitors your system so you don’t have to. Other apps only self-monitor, meaning you need to repeatedly and continuously check the status of your site in order to detect problems. But with SolarView proactive monitoring, the app checks for you and communicates with you by your choice of email, text, or device notification.
SolarView provides two types of proactive communications:
Proactive features may be configured, enabled, and disabled in SolarView settings. These features will operate as long as you have SolarView running (in foreground or background) on one of your devices. (Note: On iOS devices, background operation is dictated by the operating system rather than the app, and will depend on your usage patterns on the device. In other words, response timing may be more irregular than with the SolarView apps for Android or Windows.)
SolarView will use the notification system of your specific device (Windows, Android, or iOS) to present you with proactive notifications of production results and error conditions.
In case your mobile device isn’t handy, SolarView will send you reports and alerts to one or more email addresses that you designate, keeping you up to date on system errors, anomalies, and production status.
If you have a storage battery in your system, and have warning notifications enabled, you may configure SolarView to inform you if your battery falls below 10% capacity.
![]()
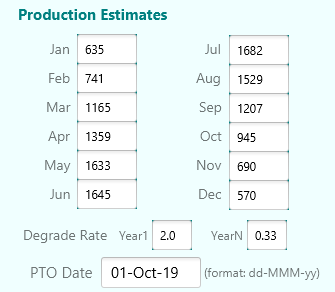
Although highly durable, solar panels will degrade in efficiency over time. This means that a 30 year old panel will not produce as much electricity as it did when it was brand new. It is important to take this factor into consideration in order for you to determine if your system is producing at the rate that it should. This is especially important if you want to hold your solar installer accountable for promises made when they sold you your system.
Solar panels typically come with 20 year warranties that guarantee that the panels will produce at least 80% of the rated power after 20 years of use. The rate at which the panels degrade depends on the brand and model of panel. Each manufacturer provides estimates for degradation rates, which are typically highest in the first year and then lower for subsequent years. For example, the LG335N1C-A5 panel is projected to degrade by 2% in the first year, and 0.5% for each subsequent year. By contrast, the LG335N1C-V5 panel is projected to lose 2% in its first year, but only 0.33% in each subsequent year. Over the course of a couple of decades, these differences can be significant.
SolarView takes this degradation into consideration as it provides you with ongoing reports of system performance. The Settings page allows you to configure the degradation rates for the panels, as provided by the panel manufacturer.
Once this information has been entered into the SolarView settings, the system will keep track of your production month over month, and year over year, so you will know if the system is producing energy at the rates guaranteed in your installation contract. If the system is falling short of your installer’s contractual guarantees you will have the data that you need to explore remedies.
