SolarView Dashboard
The SolarView Deskotop app dashboard provides you with immediate insight into the health and status of your solar energy system. Please refer to the image below as you review the details about each item in the dashboard.
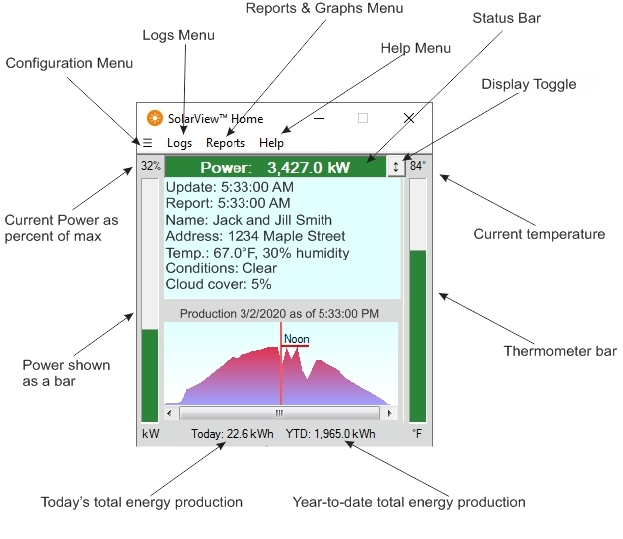
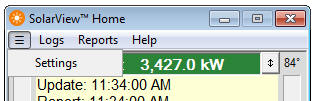
Configuraton Menu – The configuration menu provides access to various system settings and preferences. It is described here.
Logs Menu – The logs menu provides easy access to system logs which can be useful if you are trying to diagnose an issue with your solar energy system.
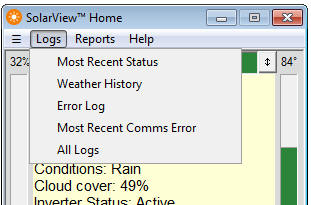
- Most Recent Status – this log shows the information produced by the most recent data provided by your inverter and other sources regarding energy production status and weather conditions.
- Weather History – this log keeps track of weather conditions including temperature, cloud cover, humidity, etc. The information is provided in “csv” format making it easy to manipulate in Excel or other compatible spreadsheet program. The weather data is logged throughout the day and archived at the end of each month. If you only want to see a snapshot of the weather log for the current day, you can obtain this by clicking on the Temperature Bar / Thermometer. This will show the weather log only for the current day.
- Error Log – This log keeps track of inverter system anomalies and also communication errors. System anomalies are described in the Troubleshooting section. Communication errors are generally temporary in nature (such as web site or internet problems) and will self-correct.
- Most Recent Comms Error – This log provides a snapshot of the most recent communications error.
- All Logs – This selection will open all logs at the same time.
Reports Menu – The Reports menu provides access to energy production reports and graphs. You may select from several pre-defined reports, or generate a custom report. SolarView will also email you a monthly report at the start of each month.
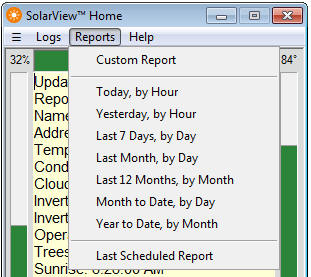
Available pre-defined reports include:
- Today, by Hour
- Yesterday, by Hour
- Last 7 Days, by Day
- Last Month, by Day
- Last 12 Months, by Month
- Month to Date, by Day
- Year to Date, by Month
In addition to these reports, you can also define a custom report by selecting Custom Report:
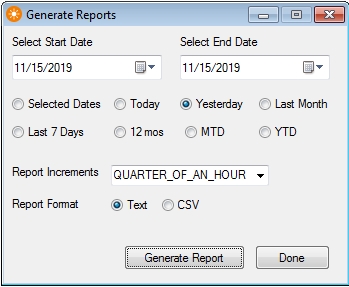
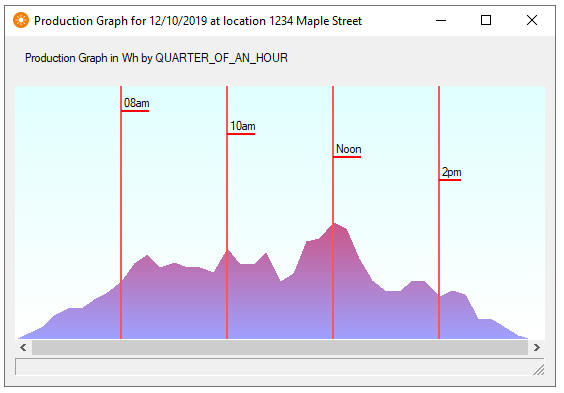
In the Generate Report dialog, you can select any combination of start and end dates as well as from several report increments. If text format is selected, generated reports include both a graph of the data and also a separate data listing in text format. For example, the images below show both the graphic and textual representations of a report for “Yesterday” with an increment of “QUARTER_OF_AN_HOUR”.

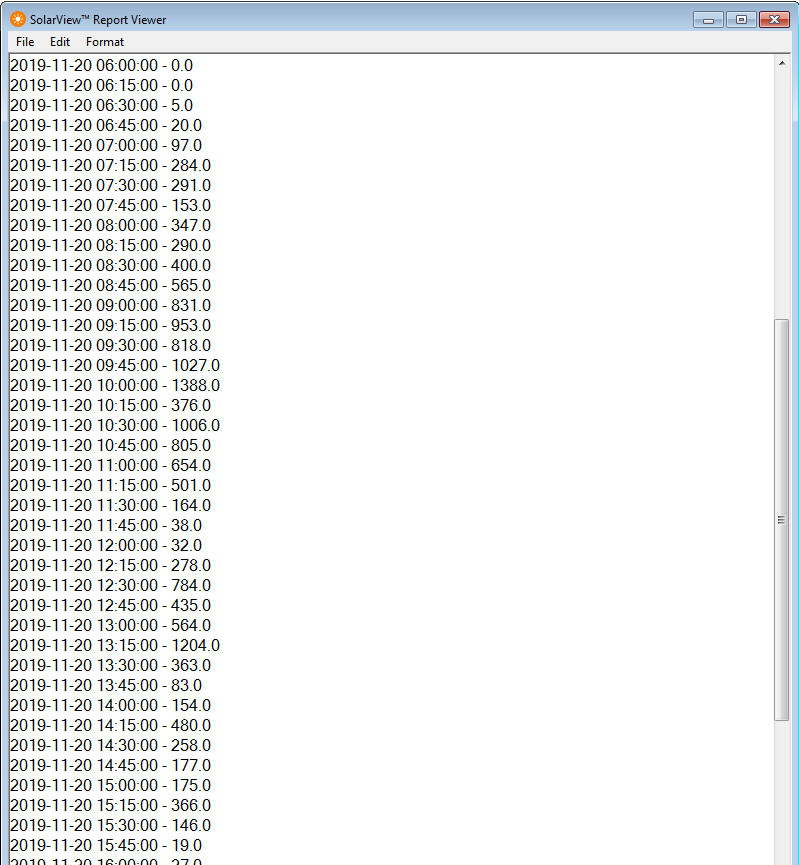
Alternatively, you may select CSV format rather than text. In this case, your default CSV application (e.g., Excel) will be launched to display your data. You may then manipulate the data for any kind of charting and graphing that you desire.
Scheduled Report – At the beginning of each month, SolarView will email you a summary report for the previous month. This email will include a daily production report for the previous month as well as a listing of any anomalies or errors that were detected during the month. The email will be sent to the email address configured in the Settings section.

Help Menu – The Help menu provides access to this user guide as well as a Support Request feature.
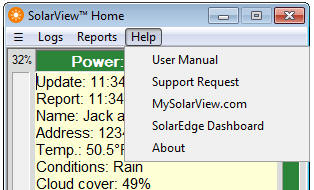
The Support Request feature may be used to submit information to us regarding a problem or feature request for the SolarView product.
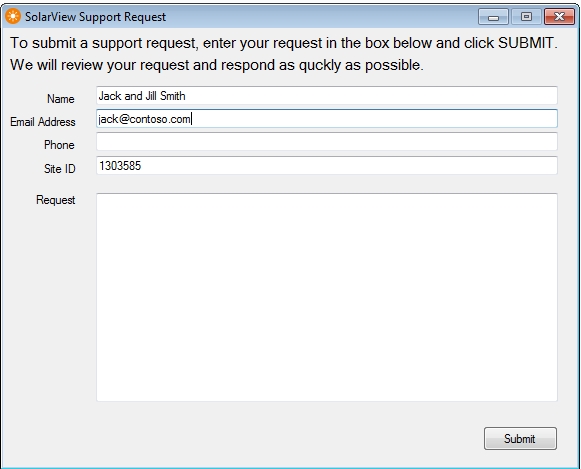
Please provide us with as much information as possible so we may review your request as expeditiously as we can.

The Status Bar rests at the top of the SolarView information window and gives you an immediate indication of the health of your system. Normally the status bar is green, indicating normal operation, however periodically you may see other colors, coded as follows:
- Green: normal operation
- Blue: initial communication with inverter
- Red: Error detected – check the Troubleshooting guide
- Orange: Anomaly detected – check the Troubleshooting guide
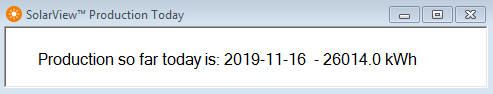
While the status is green, the Status Bar will indicate the current active power level in kW. If you click on it, a pop-up will show you today’s production so far, e.g.:
If the Status Bar is red or orange, you can click on it to be shown a summary of the error log, as an aid in troubleshooting.
The Information Window is the main central area of the SolarView display and gives you a snapshot of current operations. During daylight hours the Information Window will have a yellow background. During nighttime it will have a grey background.
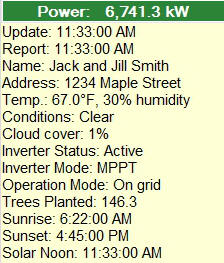
The information window contains the following items:
- Update: the time that SolarView most recently checked your system status.
- Report: the time of the most recent information from your inverter.
- Name: the name associated with the site.
- Address: the address associated with the site.
- Temp xx, yy% humidity: the current outside temperature and humidity.
- Conditions: the current weather conditions reported at the site.
- Cloud cover: the current percentage of cloud cover at the site.
- Inverter Status: status as reported by the inverter.
- Inverter Mode: the inverter mode as reported by the inverter. This would normally be “MPPT” or “PRODUCTION”.
- Operation Mode: the operation mode as reported by the inverter. Modes are “On grid”, “Off grid battery”, or “Off grid generator”.
- Trees Planted: The cumulative eco impact of the system in terms of equivalent trees planted.
- Sunrise: the time of sunrise for the site.
- Sunset: the time of sunset for the site.
- Solar Noon: the time when the sun is at its peak, which on a clear day should be the time of peak production, barring obstructions.
Display Toggle
The Display Toggle icon toggles the SolarView window between views.

- Clicking the Display Toggle will toggle the production graph on and off. When the production graph is turned off, the info window will display additional information including Inverter Status, Inverter Mode, Operation Mode, Trees Planted, Sunrise, Sunset, and Solar Noon.
- Double clicking the Display Toggle (or clicking it while holding the Shift key) will toggle between the full size SolarView window and a collapsed view. In the collapsed state, the SolarView window will only show the Menu Bar and Status Bar, so you will still have a view of current status but you will be using a minimum of screen space.
The Power Bar is on the left of the SolarView window and gives a graphic representation of current power generation as a percentage of the idealized generation capacity of your solar installation. For example, if you have a 10k installation and you are current producing 5k of energy, the bar will be half full.
The Power Bar has some associated keyboard-mouse shortcuts:
- If you click on the bar, you will be shown the production graph for the current day, in quarter hour increments.
- With the production graph in focus, the following keys are active:
- The left arrow key will show the graph for the previous day.
- The right arrow key will show the graph for the next day.
- The down arrow key will show the chart data for the currently selected day.
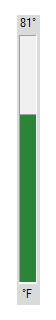
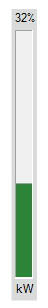
The Temperature Bar is on the right of the SolarView window. It is a thermometer indicating the current reported outside temperature at the site. This is shown by default in degrees Fahrenheit and in a range of 0 to 125 degrees, however these defaults can be changed in the Configuration menu under Preferences. If you click on the temperature bar, you will be shown the weather history for the current day.